10 Best AI Tools for Automatically Explaining Dashboard Changes

Author
Ravi Prajapati

Compare 10 AI tools that explain dashboard changes, identify KPI drivers, summarize trends, and help teams understand business performance.
A dashboard can show that revenue dropped by 15%, customer acquisition costs increased, or website conversions declined. But the number alone does not explain what happened.
Business teams need to understand why a metric changed, which factors contributed to the change, whether the movement is significant, and what they should investigate next.
AI tools for dashboard change explanation help answer these questions. They analyze business metrics, detect patterns, summarize trends, identify potential drivers, or let users ask questions in natural language.
For example, a marketing dashboard may show a 20% decrease in conversions. An AI analytics tool could help investigate whether the decline is associated with lower traffic, a change in conversion rate, a particular campaign, or a specific device category.
The exact capability varies by platform. Some tools automatically surface changes and explain potential drivers. Others generate summaries from dashboard visuals or provide conversational analytics that users can query.
This guide compares 10 AI tools that can help explain dashboard changes, with their best use cases, features, pricing context, and limitations.
Quick Answer: Which AI Dashboard Explanation Tool Should You Choose?
Best for proactively explaining KPI changes: Tableau Pulse
Best for summarizing existing Power BI reports: Microsoft Power BI Copilot
Best for dashboard-level descriptive and diagnostic insights: Zoho Analytics Zia Insights
Best for cross-platform business KPI reporting: Databox Genie
Best for conversational enterprise analytics: ThoughtSpot Spotter
Best for governed cloud data exploration: Sigma Assistant
Best for semantic-model-based conversational analytics: Google Looker Conversational Analytics
Best for AI-generated analyses within Qlik applications: Qlik Insight Advisor
Best for enterprise reporting and natural-language analysis: IBM Cognos Analytics Assistant
Best for explaining charts and querying data with flexible AI controls: Metabase Metabot
These are editorial recommendations based on documented product capabilities and intended use cases, not the results of a standardized hands-on benchmark.
What Are AI Tools for Dashboard Change Explanation?
AI tools for dashboard change explanation are analytics applications that use AI, statistical analysis, or machine learning to help users interpret changes in business metrics.
They can answer questions such as:
Why did revenue decrease this month?
Which channel contributed most to the change in conversions?
What caused customer churn to increase?
Which product categories are driving the sales decline?
Is this metric movement an anomaly or a normal fluctuation?
What changed compared with the previous reporting period?
These tools may perform one or more of the following functions:
Capability | What It Does |
|---|---|
Metric monitoring | Tracks business metrics over time |
Change detection | Identifies increases, decreases, or unusual movements |
Driver analysis | Examines dimensions that may contribute to a metric change |
Natural-language explanation | Converts analytical findings into readable summaries |
Dashboard summarization | Describes the main trends and findings in dashboard visuals |
Conversational analytics | Allows users to ask follow-up questions about data |
Predictive insights | Estimates future trends or possible outcomes |
Alerts and notifications | Sends users information about important metric changes |
Important distinction: An AI-generated explanation is not automatically proof of causation. A tool may identify an association or potential driver, but businesses should validate the explanation against the underlying data and business context.
How We Selected These AI Dashboard Explanation Tools
The comparison focuses on whether a product can help a user move from a dashboard observation to an understandable explanation.
The evaluation criteria include:
Ability to explain metric changes or summarize trends.
Ability to identify potential drivers or contributors.
Support for natural-language questions.
Compatibility with existing BI workflows or data sources.
Availability of dashboard-level insights.
Pricing transparency.
Documented product capabilities and current feature availability.
The list includes dedicated BI platforms as well as analytics products with AI explanation capabilities. These are not all standalone tools that can be added to any dashboard.
Comparison Table: 10 AI Tools for Explaining Dashboard Changes
Tool | Best For | Dashboard Change Explanation Approach | Pricing Context |
|---|---|---|---|
Tableau Pulse | Proactive metric insights | Detects trends, contributors, outliers, and metric changes | Tableau Standard starts at $15/user/month, billed annually |
Power BI Copilot | Summarizing Power BI reports | AI summaries and questions grounded in report visuals and data | Pro starts at $14/user/month, billed annually; Copilot has capacity and admin requirements |
Zoho Analytics Zia Insights | Dashboard summaries and diagnostics | Descriptive, diagnostic, and predictive insights | Zia Insights available in Premium and Enterprise plans |
Databox Genie | Business KPI reporting and AI analysis | AI analyst, performance summaries, anomaly detection | Free plan; Analyst starts at $71/month billed annually |
ThoughtSpot Spotter | Enterprise conversational analytics | Natural-language analysis, AI insights, automated change analysis | Plans vary; pricing is subscription-based and may require a quote |
Sigma Assistant | Governed cloud data exploration | Conversational analysis across accessible data sources | Contact vendor for pricing |
Looker Conversational Analytics | Semantic-model-grounded analytics | Gemini-based natural-language questions and data-agent analysis | Custom platform pricing; token quota and usage terms apply |
Qlik Insight Advisor | AI-assisted analysis in Qlik | Generates analyses from natural-language queries and selections | Qlik Cloud Analytics starts at $300/month for Starter, billed annually |
IBM Cognos Analytics Assistant | Enterprise reporting and analysis | Natural-language exploration and visualization assistance | Standard starts at $10.60/user/month; Premium at $42.40/user/month, indicative |
Metabase Metabot | Chart explanation and flexible AI data exploration | Analyzes charts and tables, answers questions, generates SQL and charts | Open Source is free; AI usage may incur provider or token costs |
Pricing is based on vendor-published information available at the research date. Plans, currencies, regional availability, AI entitlements, and billing terms can change. Check the vendor's current pricing page before purchasing.
1. Tableau Pulse
Best for proactive KPI change insights
What Is Tableau Pulse?
Tableau Pulse is a metric-focused analytics experience within Tableau Cloud. It delivers insights about metrics users follow, helping them understand important changes without manually reviewing every dashboard.
Tableau Pulse can surface insights related to metric trends, contributors, outliers, and drivers. Its insights platform can describe notable changes in natural language and provide visual explanations.
How It Explains Dashboard Changes
Imagine a sales manager tracks monthly revenue.
If revenue changes, Tableau Pulse can surface contextual information about the metric, including factors and trends that may help the manager investigate the movement.
Users can explore the metric further through guided questions and charts.
Tableau Pulse also delivers metric insights through supported channels such as email and Slack, helping teams receive updates in their workflow.
Key Features
Metric-focused insights
Trend and contributor analysis
Outlier and change identification
Natural-language insight narratives
Guided exploration of metrics
Email and Slack delivery
Best For
Organizations using Tableau Cloud that want metric-level insight delivery rather than relying entirely on manually reviewed dashboards.
Pricing
Tableau Cloud Standard starts at $15 USD per user per month, billed annually, and includes Tableau Pulse. Tableau Enterprise starts at $35 per user per month, billed annually. Tableau Cloud+ includes additional premium AI capabilities and requires a sales quote.
Limitations
It is part of the Tableau ecosystem, not a universal add-on for any dashboard.
Metric definitions and data context matter.
Some premium AI functionality may require higher-tier editions.
Generated insight narratives should be validated before being used for important business decisions.
Editorial verdict: Tableau Pulse is a strong candidate when the objective is to proactively surface meaningful KPI changes and help business users investigate them.
2. Microsoft Power BI Copilot
Best for existing Power BI reports
What Is Power BI Copilot?
Power BI Copilot is Microsoft's AI assistant for Power BI and Microsoft Fabric. It helps users summarize reports, ask questions about data, and generate insight-focused responses based on report content.
Microsoft documents report summaries that highlight trends, insights, and potential issues. Users can ask follow-up questions and receive answers that reference relevant visuals.
How It Explains Dashboard Changes
Suppose a company has a Power BI report showing:
Revenue by month
Revenue by region
Sales by product
Customer acquisition trends
A user can ask Copilot:
“Summarize the most important changes in this report and explain which regions or products may be contributing to the revenue decline.”
Copilot can generate a narrative grounded in the report's visualized data, helping users understand the main findings without manually inspecting every chart.
Key Features
Report summaries
Natural-language questions
Insight-focused responses about visuals
Follow-up conversations
Visual references in responses
Support for report and semantic model analysis
Best For
Organizations already using Power BI who want AI-assisted report summaries and natural-language exploration.
Pricing
Power BI Pro is listed at $14 USD per user per month, billed yearly. Premium Per User is listed at $24 USD per user per month, billed yearly. Copilot functionality requires eligible paid Fabric capacity, appropriate tenant configuration, and supported regional availability.
Limitations
Copilot is not included as a universally available feature in every Power BI setup.
Fabric capacity and administrator configuration are required.
Summaries depend on report design, visual metadata, labels, and data quality.
Microsoft documents that summarization may select only a subset of report visuals.
Editorial verdict: Power BI Copilot is a practical choice for companies that want to add AI explanation to reports they already maintain in Power BI.
3. Zoho Analytics Zia Insights
Best for dashboard-level diagnostic insights
What Is Zia Insights?
Zia Insights is an AI-driven feature in Zoho Analytics that analyzes reports and visualizations to provide contextual narratives about data.
Zoho describes three main types of insight:
Descriptive: What happened?
Diagnostic: Why may it have happened?
Predictive: How might a trend develop?
The diagnostic insights feature can show potential drivers and possible reasons associated with metric changes.
How It Explains Dashboard Changes
A business user can open a dashboard and invoke Zia Insights.
The dashboard summary provides a high-level view of important patterns. Diagnostic analysis can show the metric's movement, top contributing drivers, and possible reasons behind the trend.
Key Features
Dashboard summaries
Descriptive and diagnostic insights
Potential driver analysis
Predictive insight capabilities
Contextual narratives
Multi-dimensional data interpretation
Best For
Small and medium-sized businesses or analytics teams using Zoho Analytics that need dashboard summaries and potential explanations of metric movement.
Pricing
Zoho's published annual pricing lists the following starting prices:
Plan | Published Starting Price |
|---|---|
Basic | $24/month |
Standard | $48/month |
Premium | $115/month |
Enterprise | $455/month |
Zia Insights for dashboards is documented as available in Premium and Enterprise plans. Prices may vary by billing terms, region, and applicable taxes.
Limitations
Dashboard-level Zia Insights is not available in every subscription tier.
Insights depend on the reports and data available in the dashboard.
Diagnostic suggestions should be treated as potential explanations, not automatically established causal findings.
Editorial verdict: Zoho Analytics Zia Insights is one of the most directly relevant products for users who want dashboard-level explanations without building a separate AI analytics workflow.
4. Databox Genie
Best for business KPI reporting
What Is Databox Genie?
Databox is a business analytics and KPI reporting platform. Its AI analyst, Genie, is designed to help users analyze business performance using connected data sources, metrics, dashboards, and AI-powered summaries.
The Databox pricing documentation lists Genie, performance summaries, anomaly detection, and governed semantic-layer features across its plan structure, with availability and limits depending on the subscription.
How It Explains Dashboard Changes
A marketing team could use Databox to monitor metrics such as:
Website traffic
Lead generation
Conversion rates
Revenue
Advertising performance
Customer acquisition
The team can use its analytics and AI capabilities to explore performance and understand important changes across its connected data.
Key Features
AI analyst
Performance summaries
KPI dashboards
Anomaly detection
Connected data sources
Custom metrics
Governed semantic layer
AI credits for usage
Best For
Marketing teams, agencies, founders, and business teams that need to track KPIs across multiple data sources.
Pricing
Databox currently lists a Free plan with 1 user, 3 data sources, and 50 AI credits per month. Its Analyst plan is listed at $71/month billed annually, and Team plans are listed starting at $199/month billed annually.
Limitations
AI usage is limited by monthly credit allocations.
Data-source limits differ by plan.
Databox's primary strength is KPI performance analytics and reporting, rather than a general-purpose explanation add-on for every third-party dashboard.
Editorial verdict: Databox is worth evaluating when teams need AI-supported explanations of business performance across multiple KPI sources, especially in marketing and agency reporting.
5. ThoughtSpot Spotter
Best for enterprise conversational analytics
What Is ThoughtSpot Spotter?
Spotter is ThoughtSpot's AI analyst for conversational and AI-driven analytics.
ThoughtSpot's platform includes capabilities for AI-powered dashboards, automated insights, natural-language data exploration, and automated change analysis.
How It Explains Dashboard Changes
A business user might ask:
“Why did sales fall last month, and which product categories or regions contributed most?”
Spotter supports natural-language analytics that can help users explore business data, identify trends, and investigate changes.
ThoughtSpot also lists automated change analysis and AI-enabled highlights and summaries in its platform capabilities.
Key Features
Conversational analytics
AI-driven insight generation
Natural-language data exploration
Automated change analysis
Interactive dashboards
KPI monitoring and anomaly detection
AI agents for analytics workflows
Best For
Enterprise analytics teams and business users who want to explore data conversationally and investigate changes across governed data models.
Pricing
ThoughtSpot provides several subscription options. Its public pricing page lists starting rates for some plans, while other enterprise offerings require custom pricing. Pricing is influenced by the plan, data, users, and deployment requirements.
Limitations
It is a broader analytics platform, not just a lightweight dashboard explanation tool.
Enterprise setup and data modeling can require technical work.
Users should validate AI-generated insights against the data and defined business metrics.
Editorial verdict: ThoughtSpot is a strong option for organizations that want AI-driven analytics to be part of their broader data exploration and business intelligence environment.
6. Sigma Assistant
Best for governed cloud data exploration
What Is Sigma Assistant?
Sigma Assistant is Sigma's natural-language AI interface for analyzing data and building analytics applications.
Sigma's September 2026 product update describes an enhanced Assistant experience that supports exploratory questions, searches across accessible data sources, and retains conversation history so users can revisit prior insights.
How It Explains Dashboard Changes
Users can ask conversational questions about their data and investigate business performance.
For example:
“Compare this quarter's sales with the previous quarter. Which categories contributed most to the difference?”
The Assistant can help the user explore the relevant data in the context of Sigma's governed workspace.
Key Features
Natural-language data exploration
Conversational analysis
Data exploration across accessible sources
Conversation history
Analytics and dashboard creation
Governed workspace context
Best For
Teams that already work in Sigma and need a conversational interface for data exploration and business analysis.
Pricing
Sigma's pricing is based on its platform and enterprise needs. Contact Sigma for current plan and AI feature pricing.
Limitations
It is not positioned as a standalone explanation layer for arbitrary third-party dashboards.
It depends on the accessible data and workspace context.
Sigma's AI features should be evaluated within the company's existing data governance and deployment environment.
Editorial verdict: Sigma Assistant is suitable for data teams that want to make governed data exploration more accessible to business users.
7. Google Looker Conversational Analytics
Best for semantic-model-grounded analytics
What Is Looker Conversational Analytics?
Looker Conversational Analytics is a chat-with-your-data capability powered by Gemini for Google Cloud.
It lets users ask natural-language questions about data through Looker. Responses are grounded in Looker's semantic model, which defines business metrics and data relationships.
How It Explains Dashboard Changes
Users can ask questions about business metrics using natural language.
For example:
“What changed in customer churn this month, and which customer segments contributed most to the change?”
Looker can use its semantic model and query results to analyze data, interpret the findings, and generate summaries or visualizations.
Key Features
Conversational analytics powered by Gemini
Natural-language data queries
Data agents
Semantic-model grounding
Query and visualization generation
Business context and metric definitions
Governed access to data
Best For
Organizations using Looker and curated LookML models that want conversational analytics with defined business metrics.
Pricing
Looker uses platform and user-based pricing, with additional considerations for conversational analytics data-token allocations and usage. The vendor provides custom pricing rather than a single simple per-user AI add-on rate.
Limitations
Requires a Looker instance and appropriate setup.
Semantic modeling and field definitions are important for response quality.
Google warns that Gemini-based analytics can generate plausible but incorrect responses, so results should be validated.
Editorial verdict: Looker Conversational Analytics is a good fit for enterprises that have already invested in Looker and want AI analysis grounded in governed business definitions.
8. Qlik Insight Advisor
Best for AI-assisted analysis in Qlik
What Is Qlik Insight Advisor?
Qlik Insight Advisor is a suite of AI-assisted analytics features in Qlik Sense. It helps users generate analyses and visualizations through natural-language searches, selections, and guided analysis types.
Qlik documents Insight Advisor Search and Insight Advisor Analysis Types as ways to generate visual analyses from questions or selected fields.
How It Explains Dashboard Changes
A user can ask a natural-language question about a metric or select relevant fields to generate an analysis.
For example:
“Show the factors associated with the decrease in sales by region.”
Insight Advisor can generate relevant analyses that help users explore the metric and its dimensions.
Key Features
Natural-language analysis
AI-generated visualizations
Guided analysis types
Data-model-aware exploration
Suggested analyses
Business logic support
Best For
Teams that use Qlik Sense and want AI-assisted analysis within their existing analytics environment.
Pricing
Qlik Cloud Analytics offers Starter, Standard, Premium, and Enterprise subscription tiers. Its published US pricing currently lists Starter at $300/month for 10 users, Standard at $825/month, and Premium at $2,750/month, all billed annually. Enterprise pricing is custom.
Limitations
It is part of the Qlik ecosystem.
It generates analyses that users may need to interpret further.
Insight Advisor is not available in edit mode, according to Qlik's documentation.
Editorial verdict: Qlik Insight Advisor is useful for organizations that already use Qlik and want to make analytical exploration easier for business users.
9. IBM Cognos Analytics Assistant
Best for enterprise reporting and analysis
What Is IBM Cognos Analytics Assistant?
IBM Cognos Analytics includes an embedded AI assistant that supports natural-language input to help users explore data, create visualizations, and gain insights.
The assistant can be used to access data sources and create visualizations that users can add to an exploration or dashboard.
How It Explains Dashboard Changes
A user can ask a question about business performance and use the assistant to explore the relevant data.
For example:
“Compare this month's revenue with the previous month and show the regions with the largest changes.”
The assistant can help users generate visualizations and explore the information needed to investigate the difference.
Key Features
Natural-language data exploration
AI-assisted visualization creation
Data-source context
Dashboard and exploration support
Enterprise reporting capabilities
Embedded assistant interface
Best For
Organizations using IBM Cognos Analytics for enterprise reporting and business intelligence.
Pricing
IBM's published indicative pricing lists:
Plan | Starting Price |
|---|---|
Standard | $10.60 per authorized user/month |
Premium | $42.40 per authorized user/month |
Prices are indicative, may vary by country, exclude taxes, and depend on product availability.
IBM Cognos Analytics
Limitations
The assistant requires administrator-enabled permissions.
IBM documents that text input is supported in English only.
The product is primarily intended for users in the Cognos Analytics environment.
IBM
Editorial verdict: IBM Cognos Analytics Assistant is worth considering for enterprise organizations that already use Cognos for reporting and want AI-assisted data exploration.
10. Metabase Metabot
Best for chart explanation and flexible AI data exploration
What Is Metabase Metabot?
Metabot is Metabase's built-in AI assistant. It helps users analyze data, create charts, generate SQL, fix query errors, and explore existing visualizations.
Metabase documents that Metabot can analyze charts and tables, answer natural-language questions, and help users create visualizations.
How It Explains Dashboard Changes
A user can open a chart or table and ask Metabot to analyze the results.
For example:
“Explain this chart. What are the biggest changes between the two periods, and which categories should I investigate?”
Metabot can analyze the existing chart or table, helping the user explore the data behind the dashboard.
Key Features
Chart analysis
Table analysis
Natural-language data questions
SQL generation
Chart creation
Query editing
AI controls and permissions
Best For
Teams using Metabase that want AI-assisted chart analysis, natural-language querying, and flexible controls over AI usage.
Pricing
Metabase offers an Open Source plan for free. Its published Starter pricing begins at $100/month, or $90/month when billed annually, plus user fees. AI capabilities may use a customer's own AI provider API key or Metabase's usage-based AI service.
Limitations
Metabot is part of the Metabase environment, rather than a general dashboard explanation layer.
SQL-generated results should be reviewed before execution.
AI analysis depends on the query, chart, accessible data, and context.
Editorial verdict: Metabot is a practical option for teams that need AI help analyzing existing charts and querying data without moving to a large enterprise BI platform.
Which AI Dashboard Explanation Tool Is Best for Your Use Case?
The right product depends on whether you want automated explanations, dashboard summaries, conversational analysis, or deeper diagnostic capabilities.
Business Requirement | Recommended Tool | Why |
|---|---|---|
Automatically surface KPI changes | Tableau Pulse | Designed around metric insights and change detection |
Summarize an existing Power BI report | Power BI Copilot | Summarizes report visuals and answers questions about report data |
Explain dashboard metrics and potential drivers | Zoho Analytics Zia Insights | Includes descriptive and diagnostic insight capabilities |
Analyze KPIs from multiple business sources | Databox Genie | Focuses on business performance reporting and AI analysis |
Ask complex business questions across data | ThoughtSpot Spotter | Conversational analytics and AI-driven insights |
Explore governed cloud data conversationally | Sigma Assistant | AI exploration within Sigma's governed workspace |
Use AI with curated semantic models | Looker Conversational Analytics | Uses LookML business definitions to ground answers |
Generate analyses from natural-language queries | Qlik Insight Advisor | AI-assisted analyses and visualizations |
Support enterprise BI reporting workflows | IBM Cognos Analytics Assistant | Embedded assistant for reporting and exploration |
Explain a specific chart or table | Metabase Metabot | Offers chart and result analysis inside Metabase |
Automatic Explanation vs Conversational Explanation
One of the most important differences between these tools is how the user receives an explanation.
Automatic or proactive insights
The system monitors or analyzes metrics and surfaces notable changes, patterns, contributors, or alerts.
Examples: Tableau Pulse, Databox performance summaries, selected ThoughtSpot capabilities.
Conversational explanation
The user asks a question about the dashboard or data, and AI responds with a summary or analysis.
Examples: Power BI Copilot, Looker Conversational Analytics, Sigma Assistant, Metabot.
Some platforms support both approaches. The distinction matters because a company that wants to receive explanations without asking questions has a different requirement from a company that wants an AI analyst available on demand.
What Should You Evaluate Before Choosing an AI Dashboard Explanation Tool?
AI-generated explanations can save time, but the quality of an explanation depends on data quality, business definitions, access permissions, and analytical context.
1. Data Accuracy and Business Definitions
The tool should use the correct definition of each metric.
For example, “revenue” may mean gross revenue, net revenue, recognized revenue, or recurring revenue. If the AI uses the wrong definition, the explanation may be misleading even if the calculations are technically correct.
Look for:
Defined metrics
Clear dimensions
Data lineage
Consistent business logic
Governed semantic models
2. Explanation Quality
A useful explanation should identify the metric movement and provide evidence or supporting detail.
For example, instead of only saying:
“Revenue decreased this month.”
A better analysis would explain:
“Revenue decreased compared with the previous month. The largest observed contribution to the decline came from the Enterprise segment. Review changes in customer count, average deal size, and renewal performance to validate the drivers.”
The second example is an illustrative explanation, not a claim about any particular tool's output.
3. Ability to Drill Down
Users should be able to investigate the explanation.
Useful drill-down dimensions can include:
Geography
Product
Customer segment
Marketing channel
Sales representative
Device type
Time period
4. Explanation and Causal Reliability
An AI explanation may describe correlation or identify potential drivers. It should not automatically be interpreted as a proven cause.
For example, a decline in conversions and a decrease in paid advertising traffic may occur together. This does not by itself prove that the advertising change caused the conversion decline.
5. Integration With Existing BI Systems
Before selecting a platform, check:
Which data sources it supports
Whether it can access existing dashboards
Whether it requires data migration
Whether it supports existing permissions
Whether AI features require a specific platform tier
Whether the data model must be reconfigured
6. Security and Governance
Business dashboards can contain sensitive information. Evaluate:
Role-based access control
Row-level security
Data retention policies
AI provider data processing terms
Audit logs
Administrative controls
Enterprise deployment requirements
7. Total Cost
The subscription price may not include the entire cost of deployment.
Consider:
User licenses
BI platform subscriptions
AI credits or tokens
Data connectors
Implementation effort
Data modeling
Security configuration
Training and support
A Practical Workflow for Explaining Dashboard Changes With AI
Businesses can get more reliable results when they follow a consistent process instead of asking AI to explain a dashboard without context.
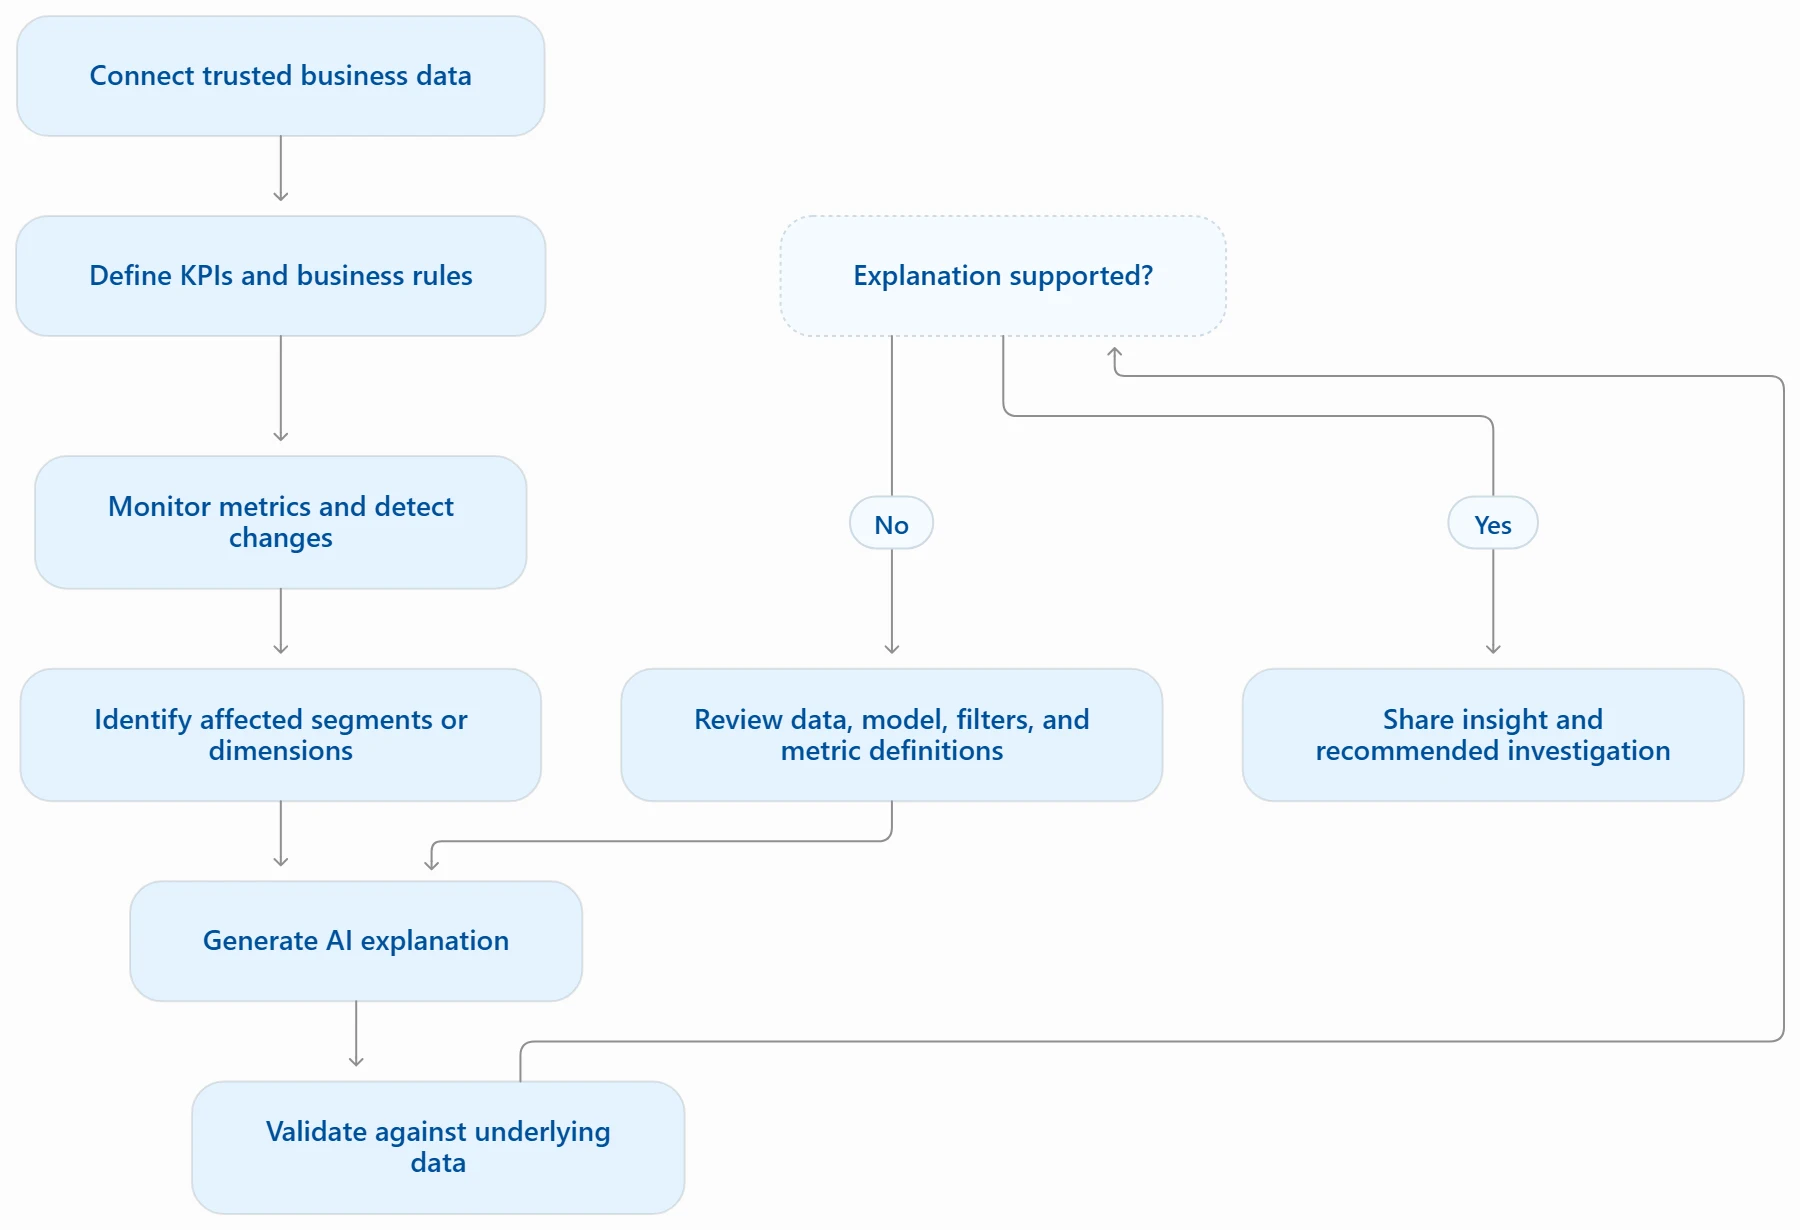
Step 1: Connect the Relevant Data
Start with the data sources that contain the business metric.
For example, a marketing dashboard may use:
Google Analytics
CRM data
Advertising platforms
Lead management systems
Step 2: Define the KPI
Specify the metric, its calculation, and its comparison period.
For example:
KPI: Marketing-qualified leads
Current period: October
Comparison period: September
Comparison type: Month-over-month
Breakdown: Marketing channel
Step 3: Detect the Change
Identify whether the metric increased, decreased, or deviated from its expected range.
The system should consider the comparison period and the business context. A 10% change may be significant for one metric and normal variation for another.
Step 4: Investigate Potential Drivers
Analyze relevant dimensions such as channel, campaign, geography, customer segment, or product.
Step 5: Generate the Explanation
The AI should explain:
What changed?
How much did it change?
Which dimensions contributed?
What supporting evidence is available?
What should the user investigate next?
Step 6: Validate the Result
Check the underlying data and calculations before acting on the explanation.
This is especially important when the insight affects budget allocation, sales planning, financial reporting, or other business decisions.
Frequently Asked Questions
1. What is the best AI tool for automatically explaining dashboard changes?
Tableau Pulse is a strong option for proactive metric insights and contextual explanations. Zoho Analytics Zia Insights is particularly relevant for dashboard summaries and diagnostic insights. Power BI Copilot is a good choice for teams that already use Power BI and want AI-generated report summaries.
The best choice depends on whether the requirement is proactive change detection, dashboard summarization, or conversational data exploration.
2. Can AI explain why a dashboard metric increased or decreased?
Yes. Some AI analytics tools can identify trends, potential drivers, contributors, and unusual changes in business metrics. However, the explanation may show an association rather than a proven cause. Businesses should validate the findings using the underlying data and their business context.
3. Can AI automatically summarize a Power BI dashboard?
Microsoft Power BI Copilot can generate report summaries, answer questions about report visuals, and highlight trends or potential issues. Availability depends on eligible Fabric capacity, administrator configuration, and supported regions.
4. Which AI tools identify the drivers behind KPI changes?
Tableau Pulse, Zoho Analytics Zia Insights, and ThoughtSpot offer documented capabilities related to metric insights, potential drivers, or automated change analysis. The depth and method of analysis vary by platform.
Comments (0)
No comments yet. Be the first to share your thoughts!