Best LLM Observability Platforms in 2027: 10 Tools Compared

Author
Ravi Prajapati

Compare 10 LLM observability platforms for tracing, evaluations, monitoring, cost control, and AI application debugging in 2027.
An LLM observability platform helps engineering teams understand how large language model applications behave in practice. It captures model calls, prompts, responses, tool executions, retrieval steps, latency, token usage, and other telemetry so teams can investigate failures, evaluate output quality, and control operating costs.
The best platform depends on what you need to observe. Langfuse and Arize Phoenix are strong starting points for teams prioritizing open-source observability, LangSmith suits teams working with LangChain and agent workflows, Weights & Biases Weave connects tracing with evaluation, and Datadog is worth considering for organizations that want AI observability alongside broader application monitoring. These are use-case-based recommendations, not results from a standardized performance benchmark.
This guide compares 10 LLM observability platforms by their core capabilities, deployment considerations, evaluation workflows, and ideal use cases. It also explains what to check before purchasing, how to estimate the total cost, and how to run a meaningful proof of concept.
Quick comparison: 10 LLM observability platforms
The following shortlist covers developer-focused tools, open-source options, evaluation platforms, and enterprise observability solutions. The descriptions reflect the capabilities documented by their vendors; the shortlist is not a claim that these are the ten highest-ranked platforms in the market.
Platform | Best suited for | Main strength | Key consideration |
|---|---|---|---|
Langfuse | Teams wanting open-source observability | Tracing, cost analytics, scores, and monitoring | Self-hosting requires operational ownership |
LangSmith | LangChain and agent developers | Trace inspection, monitoring, and evaluation workflows | Review usage-based costs and framework fit |
Arize Phoenix | AI engineers and ML teams | Open-source tracing, experiments, and evaluations | Managed production requirements may call for a separate service |
Weights & Biases Weave | Teams iterating on AI quality | Tracing, evaluation, and production feedback | Assess how well it fits existing experiment workflows |
Datadog Agent Observability | Enterprise operations teams | AI traces alongside application monitoring | LLM span ingestion is a cost factor |
LangWatch | Teams emphasizing testing and safety | Experiments, online evaluations, and guardrails | Validate the integrations and controls needed for your application |
Helicone | Developers wanting visibility into API traffic | Request logging, cost and latency tracking, and AI gateway capabilities | Distinguish gateway functionality from deeper application tracing |
MLflow Tracing | ML engineering and self-managed stacks | Open-source tracing and OpenTelemetry compatibility | Plan the hosting, storage, and operations work |
Braintrust | Product and engineering teams improving AI quality | Production traces connected to evaluation workflows | Evaluate the cost and workflow implications of usage at scale |
HoneyHive | Enterprises operating complex AI agents | Agent tracing, evaluation, and deployment flexibility | Check enterprise plan requirements and implementation effort |
These distinctions are based on each provider's published product information, not a hands-on test of all ten products.
What is an LLM observability platform?
An LLM observability platform is software that collects and analyzes telemetry from applications powered by large language models. It helps teams understand how an application produced a response, where a failure occurred, how much a request cost, and whether the output met the expected quality standard.
Unlike basic API logging, LLM observability can connect model calls with prompts, retrieved documents, tool executions, intermediate outputs, and evaluation results. This is particularly useful for retrieval-augmented generation (RAG) applications and AI agents that execute multiple steps before responding to a user.
A typical platform combines five capabilities:
Tracing: Reconstructs the steps involved in an individual request.
Performance monitoring: Tracks latency, errors, throughput, and token consumption.
Cost analysis: Helps attribute model usage and spending to requests, features, or workflows.
Quality evaluation: Scores responses for criteria such as relevance, groundedness, correctness, or task completion.
Feedback and alerting: Connects observed failures to human reviews, quality trends, and operational alerts.
Not every platform provides all five capabilities with equal depth. Some focus on developer debugging, others on model evaluation, and others on enterprise monitoring.
LLM observability vs. traditional application monitoring
Traditional application performance monitoring (APM) answers questions such as whether a service is available, how long an API request takes, and which infrastructure component is failing. LLM observability adds visibility into the behavior and quality of AI-generated outputs.
Requirement | Traditional APM | LLM observability |
|---|---|---|
Request latency and errors | Core capability | Core capability |
Prompt and response inspection | Usually requires custom instrumentation | Common capability |
Model and token cost attribution | Not typically a native focus | Common capability |
Retrieval and tool-call inspection | Depends on instrumentation | Often supported |
Semantic response evaluation | Requires additional tooling | Available in many platforms |
Prompt and model regression testing | Usually external to APM | Supported by evaluation-focused tools |
The two approaches complement each other. A production AI application may need both infrastructure-level monitoring and AI-specific tracing. A platform that supports OpenTelemetry or integrates with an existing APM stack can help reduce fragmented monitoring, but compatibility should be verified rather than assumed.
10 best LLM observability platforms compared
1. Langfuse: Best for open-source LLM observability
Best for: Development teams that want control over their observability stack and the option to self-host.
Core capabilities: Tracing, model usage and cost tracking, dashboards, scores, and monitoring.
Langfuse is an open-source LLM engineering and observability platform designed to help teams inspect application behavior and use production traces to improve quality. Its documentation describes traces containing prompts, model responses, token usage, latency, metadata, and intermediate tool or retrieval steps. Teams can use this data to investigate failures and build more systematic evaluation workflows.
Why consider Langfuse
Provides detailed traces for multi-step LLM applications.
Supports monitoring of cost, latency, and application quality.
Allows teams to choose a self-hosted deployment approach.
Connects observed production behavior with evaluation and improvement work.
Limitations to evaluate
Open-source software does not eliminate the cost of running a production service. Self-hosting requires decisions about databases, storage, backups, upgrades, access controls, and availability. Teams should also confirm retention limits and the exact features available in their preferred deployment model.
Verdict: Langfuse is a strong candidate for engineering teams that value deployment flexibility and want observability integrated into their AI development process.
2. LangSmith: Best for LangChain and agent workflows
Best for: Teams building LLM applications and agents with LangChain or compatible frameworks.
Core capabilities: Agent tracing, production monitoring, debugging, and online and offline evaluations.
LangSmith provides tooling for inspecting how AI applications and agents execute. Engineers can follow individual steps, investigate tool calls, examine model outputs, and identify problems affecting latency, cost, or response quality. Its observability offering also supports monitoring and evaluation workflows.
Why consider LangSmith
Useful for debugging complex chains and agent executions.
Connects tracing with testing and evaluation workflows.
Supports several programming languages and integrations beyond a single framework.
Offers usage-based plans, with enterprise deployment and security options.
Limitations to evaluate
Teams should assess their framework mix before committing. A company running multiple frameworks can still consider LangSmith, but it should test how easily its instrumentation captures the entire workflow rather than only individual model calls.
Pricing also deserves attention. The vendor's published plans include trace allowances and additional usage charges, so costs depend on more than the listed seat price.
Verdict: LangSmith is a natural shortlist candidate when developers want tracing, evaluation, and debugging within a LangChain-oriented development workflow.
3. Arize Phoenix: Best for open-source AI experimentation and evaluation
Best for: AI engineers and data scientists who want to investigate, evaluate, and improve models and applications.
Core capabilities: Tracing, evaluations, datasets, experiments, and prompt experimentation.
Phoenix is an open-source observability and evaluation tool from Arize AI. Its documented capabilities include tracing, evaluation, datasets, experiments, and a prompt playground. It uses OpenTelemetry-based instrumentation and OpenInference conventions to help teams collect and inspect application traces.
Why consider Arize Phoenix
Offers an open-source foundation for AI tracing and evaluation.
Helps teams compare changes to prompts and models through experiments.
Supports evaluation of responses and retrieval behavior.
Provides a path for teams that prefer running observability infrastructure themselves.
Limitations to evaluate
Open-source functionality and a managed enterprise service are not interchangeable. Organizations should confirm which deployment, access-control, support, and scaling features they require. They should also test the instrumentation against their actual framework and retrieval architecture.
Verdict: Phoenix deserves consideration when evaluation and experimentation matter as much as production debugging, particularly for teams that prefer open-source tooling.
4. Weights & Biases Weave: Best for evaluation-driven AI development
Best for: Teams that regularly compare prompts, models, datasets, and agent versions.
Core capabilities: Tracing, evaluations, scorer comparisons, experiment tracking, and production monitoring.
Weave connects observability with the iterative process of improving AI applications. Its documented evaluation workflows use datasets and scorers to measure outcomes across dimensions such as accuracy, latency, cost, and user experience. Teams can compare evaluation runs and trace results back to the code, datasets, and scorers used.
Why consider Weave
Connects production traces with repeatable evaluation workflows.
Helps identify regressions after model or prompt changes.
Supports collaborative analysis and experiment comparisons.
Offers monitoring features aimed at production agents.
Limitations to evaluate
Teams should check how Weave fits with their existing experiment tracking, data management, and monitoring tools. They should also validate whether its available evaluation signals align with their application-specific definition of success.
Verdict: Weave is worth evaluating when an engineering team wants a repeatable feedback loop from production behavior to testing and improvement.
5. Datadog Agent Observability: Best for enterprise operations
Best for: Organizations already using Datadog for application performance and infrastructure monitoring.
Core capabilities: Agent traces, latency and cost monitoring, quality analysis, sensitive-data controls, and insights.
Datadog's Agent Observability offering lets teams inspect LLM inference requests and multi-step workflows as traces containing spans. Its documented capabilities include troubleshooting, monitoring cost and latency, investigating response patterns, and examining privacy or safety concerns. It also provides insights into recurring cost and reliability problems.
Why consider Datadog
Connects AI application monitoring with broader operational observability.
Supports end-to-end investigation of multi-step requests.
Offers dashboards for usage, performance, and cost.
Can help teams that already have established Datadog workflows.
Limitations to evaluate
The vendor states that Agent Observability is billed according to ingested LLM spans. A single agent workflow may generate multiple spans, so cost modeling should use realistic request volumes and workflow complexity rather than counting only user requests.
Organizations should also verify the precise AI evaluation, privacy, and security capabilities available under their intended configuration.
Verdict: Datadog is a strong candidate when the goal is to bring AI-specific signals into an established enterprise observability environment.
6. LangWatch: Best for evaluation, testing, and guardrails
Best for: Teams that want to connect pre-deployment experiments with production quality checks.
Core capabilities: Experiments, online evaluation, evaluators, and guardrails.
LangWatch documents an evaluation lifecycle built around testing before deployment and evaluating application behavior in production. Its evaluation tooling includes experiments, online evaluation, evaluators, and guardrails. This makes it relevant to teams that want quality checks to be part of the release process rather than a separate activity after deployment.
Why consider LangWatch
Supports evaluation before and after deployment.
Provides a framework for testing application quality.
Includes guardrail-related workflows.
Can fit teams that want to establish release checks for AI behavior.
Limitations to evaluate
A guardrail or evaluator is only as useful as its criteria and test coverage. Teams should validate false positives, missed failures, evaluation latency, and how well the platform integrates with their application and deployment pipeline.
Verdict: LangWatch is worth shortlisting when structured evaluation and safeguards are central to the team's observability requirements.
7. Helicone: Best for API-level visibility and gateway workflows
Best for: Developers who want to inspect model API traffic and monitor usage with relatively straightforward integration.
Core capabilities: Request logging, trace inspection, cost and latency tracking, and AI gateway features.
Helicone combines LLM observability with AI gateway functionality. Its project documentation describes request logging across supported providers and frameworks, trace and session inspection, cost and latency analysis, prompt management, and routing features such as model access and fallbacks.
Why consider Helicone
Provides visibility into model API requests.
Helps track cost and latency across model usage.
Combines observability with gateway capabilities.
May be useful for teams standardizing access to multiple model providers.
Limitations to evaluate
API-level logging alone may not capture every meaningful application step. If your agent uses internal tools, custom business logic, or complex retrieval workflows, test whether instrumentation exposes enough detail to identify the root cause of a bad answer.
Also assess whether the gateway features duplicate capabilities you already operate elsewhere.
Verdict: Helicone is a practical candidate for teams that want model request visibility and gateway features in the same workflow.
8. MLflow Tracing: Best for self-managed ML engineering environments
Best for: ML engineers who want open-source tracing integrated with model development and evaluation.
Core capabilities: LLM and agent tracing, evaluation workflows, token and latency tracking, and OpenTelemetry compatibility.
MLflow Tracing captures inputs, outputs, metadata, and intermediate execution steps for LLM applications and agents. The project documents support for multiple model providers and frameworks, manual instrumentation, automatic tracing integrations, production monitoring, and OpenTelemetry-compatible data exchange.
Why consider MLflow Tracing
Open-source tooling can reduce dependence on a proprietary observability backend.
Connects tracing with ML experimentation and evaluation workflows.
Supports Python and JavaScript/TypeScript use cases.
Offers control over where trace data is stored.
Limitations to evaluate
The software may be free to use, but hosting and operating a production service still incur costs. Teams should assess storage, retention, access control, scaling, and the engineering effort required to operate the chosen deployment.
Verdict: MLflow Tracing is a strong option for teams already using MLflow or looking for an open-source, OpenTelemetry-compatible tracing foundation.
9. Braintrust: Best for production quality evaluation
Best for: Product and engineering teams that want to turn production failures into repeatable quality tests.
Core capabilities: Production tracing, quality scoring, evaluation datasets, monitoring, and regression detection.
Braintrust focuses on connecting production behavior with measurable AI quality. Its published observability offering describes tracing prompts, responses, tool calls, retrieved context, and intermediate steps. Teams can score production traffic and use failures to inform datasets and subsequent regression tests.
Why consider Braintrust
Connects production traces with evaluation workflows.
Supports automated and human-based quality scoring.
Helps teams investigate changes in quality, latency, and cost.
Provides a path from observed failures to repeatable testing.
Limitations to evaluate
Evaluation results depend on the quality of the dataset, scoring rubric, and evaluator. Teams should test whether the platform can represent their actual business requirements, including cases where correctness cannot be judged by a simple similarity score.
Verdict: Braintrust is worth considering when the main objective is not merely to collect traces but to turn them into a continuous improvement process.
10. HoneyHive: Best for complex, long-running enterprise agents
Best for: Organizations running multi-step agents that require trace inspection, evaluation, and stronger data-control options.
Core capabilities: Agent trajectory tracing, production evaluation, alerts, experiments, and deployment choices.
HoneyHive positions its platform around agent observability and evaluation. Its published product information describes step-by-step inspection of tool calls and prompts, support for long-running agent trajectories, production quality monitoring, evaluation workflows, and alerts when quality scores breach defined thresholds. The company also describes SaaS, hybrid, and self-hosted deployment options.
Why consider HoneyHive
Designed for examining multi-step agent behavior.
Connects production monitoring with evaluations and human feedback.
Supports workflows for turning observed failures into test cases.
Offers deployment options for organizations with different data-control needs.
Limitations to evaluate
Enterprise deployment choices do not automatically guarantee compliance with a particular organization's requirements. Confirm the contractual terms, security controls, data residency, retention behavior, and availability of the features you need.
Verdict: HoneyHive is a relevant option for organizations that need deeper agent-level visibility and want to connect operational monitoring with quality and governance workflows.
Which LLM observability platform should you choose?
The right choice depends on the application architecture, how the engineering team works, and what the organization needs to control. A small development team debugging model calls has different requirements from a regulated enterprise operating agents across multiple business units.
Use the following decision table as a starting point.
Your main requirement | Shortlist first | Why |
|---|---|---|
Open-source observability | Langfuse, Arize Phoenix, MLflow Tracing | All offer open-source foundations for relevant tracing or evaluation workflows |
LangChain-oriented agent debugging | LangSmith | Closely aligned with the LangChain development ecosystem |
Repeatable evaluations and regression testing | Braintrust, Weave, LangWatch | Emphasize evaluation workflows alongside application improvement |
AI visibility alongside enterprise APM | Datadog | Extends an established operational observability environment |
API request visibility and gateway functionality | Helicone | Combines request-level observability with gateway features |
Complex agent trajectories and enterprise controls | HoneyHive | Focuses on agent tracing, evaluations, and deployment flexibility |
These are starting points for a shortlist, not substitutes for a technical evaluation. Integration quality, retention, pricing, and data handling can change the final decision.
What features should an LLM observability platform include?
Before comparing vendors in a demo, define the capabilities that matter to your application. A polished dashboard is not enough if the platform cannot trace a failed agent action or reliably evaluate a poor response.
1. End-to-end tracing
Tracing should connect a user request to the operations that produced the final answer. For an agent, this may include model calls, retrieval, tool execution, retries, and intermediate decisions.
Look for:
Nested traces and spans that expose the complete request path.
Inputs and outputs at relevant execution steps.
Model identifiers, token counts, latency, and error details.
Session or conversation identifiers for multi-turn interactions.
Support for the frameworks and languages your application actually uses.
2. Evaluation and quality monitoring
Operational success does not necessarily mean an AI application is correct. A request may return HTTP 200 while producing an unsupported answer, using the wrong tool, or retrieving irrelevant information.
An observability platform should help you evaluate outcomes against explicit criteria. Depending on the use case, these may include answer correctness, groundedness, retrieval relevance, policy compliance, task completion, and tool-call accuracy.
Use automated evaluations for scale, but validate them against human-reviewed examples. An LLM-based evaluator can also make mistakes, so its scores should not automatically be treated as ground truth.
3. Cost and latency attribution
A total monthly model bill does not explain which feature is expensive or why a workflow has become slower.
Useful cost and performance reporting should connect model usage to individual requests, application features, and agent steps. It should also distinguish model inference time from retrieval, external API calls, and other application processing where the instrumentation permits.
4. Alerts and production monitoring
The platform should help the team notice meaningful changes before they become widespread user problems.
Examples include:
A rise in the rate of failed tool calls.
A decline in groundedness scores.
Increased latency after a prompt or model change.
Unexpected token consumption for a particular feature.
An increase in requests that trigger safety or policy checks.
Alert thresholds should be tied to the application's service and quality objectives, rather than chosen arbitrarily.
5. Privacy, access control, and data retention
LLM traces may contain customer messages, retrieved documents, personal information, internal instructions, and tool outputs. Observability can therefore create a sensitive data store of its own.
Review data redaction, role-based access, encryption, retention controls, deletion procedures, audit logs, regional processing, and deployment options. Where required, verify contractual and regulatory commitments directly with the vendor.
The NIST Generative AI Profile provides a useful risk-management reference for organizations evaluating the trustworthiness of generative AI systems. It does not certify any particular observability product.
LLM observability platform architecture: How the pieces fit together
A useful observability architecture connects telemetry collection, trace storage, analysis, evaluation, and operational response. The exact components vary by product, but the underlying workflow is broadly similar.
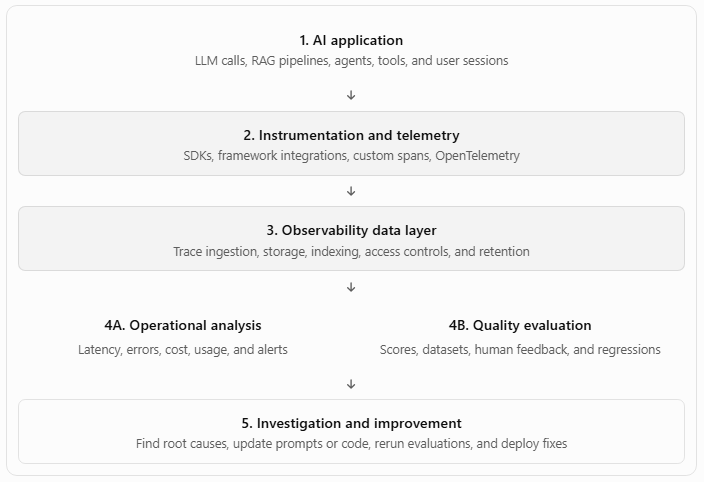
Conceptual architecture: an editorial synthesis of common observability workflows, not a vendor-specific deployment diagram.
The key design principle is to connect operational evidence with quality evidence. A latency dashboard may reveal that an application slowed down, while a trace explains which retrieval or tool step caused the delay. An evaluation may then show whether a proposed fix restored answer quality.
OpenTelemetry is relevant because it defines common conventions for collecting and interpreting telemetry. Before adopting a vendor-specific SDK throughout an application, review its semantic conventions and the platform's supported export and ingestion paths. Compatibility can improve portability, although it does not guarantee that every vendor-specific feature or evaluation result transfers between systems.
How to calculate the total cost of LLM observability
The cheapest subscription is not necessarily the cheapest production deployment. Observability costs can include usage-based charges, seats, data retention, storage infrastructure, and the engineering time required to operate or maintain integrations.
A practical total-cost model is:

This is a budgeting framework, not a vendor pricing formula. Each provider may meter its service differently.
What drives the cost?
Trace volume: A workflow that calls several models and tools can generate multiple spans for one user request. Confirm whether the vendor bills by request, span, event, token, or another unit.
Retention: Keeping detailed traces for months can cost more than retaining them briefly for debugging. Determine which traces must remain available for audits, incident investigations, and quality analysis.
Evaluation frequency: Automated evaluation can add model calls or computing costs. Continuous scoring of every production interaction may be unnecessary if a carefully designed sampling strategy provides enough signal.
Deployment and support: Self-hosted software may avoid a vendor's observability subscription, but it still requires infrastructure, maintenance, monitoring, backups, and engineering ownership.
Data export: Confirm whether exporting traces to a warehouse, SIEM, or existing monitoring system incurs additional charges or requires a particular plan.
How to compare pricing fairly
Ask each shortlisted vendor to estimate costs using the same scenario:
Expected monthly user requests.
Average number of model calls and spans per request.
Average trace size and expected retention period.
Number of users and required access controls.
Frequency of online and offline evaluations.
Expected peak traffic and required availability.
Use these inputs to request a written estimate, then test the assumptions during a pilot. Do not compare a self-hosted deployment's software price with a managed service's subscription price without accounting for operations and support.
How to choose an LLM observability platform in five steps
A short, structured evaluation is more useful than choosing the platform with the longest feature list.
Map your application architecture
Identify model providers, frameworks, retrieval systems, agent tools, external APIs, and deployment environments. List the steps that must appear in a trace to diagnose a real failure.
Define measurable acceptance criteria
Specify the operational and quality outcomes that matter. Examples include complete trace capture for critical workflows, useful error attribution, reliable evaluation results, and acceptable overhead.
Check integration and portability
Instrument the same representative workflow in each shortlisted platform. Verify the availability of relevant trace fields, framework support, export paths, and migration options.
Run realistic failure tests
Include incorrect retrieval, failed tool calls, slow model responses, excessive token use, and poor-quality answers. Check whether engineers can identify the cause without extensive manual reconstruction.
Calculate production cost and operational effort
Estimate usage at expected and peak volumes. Include retention, evaluation, security, support, and maintenance, then select the platform that meets the requirements with the least unnecessary complexity.
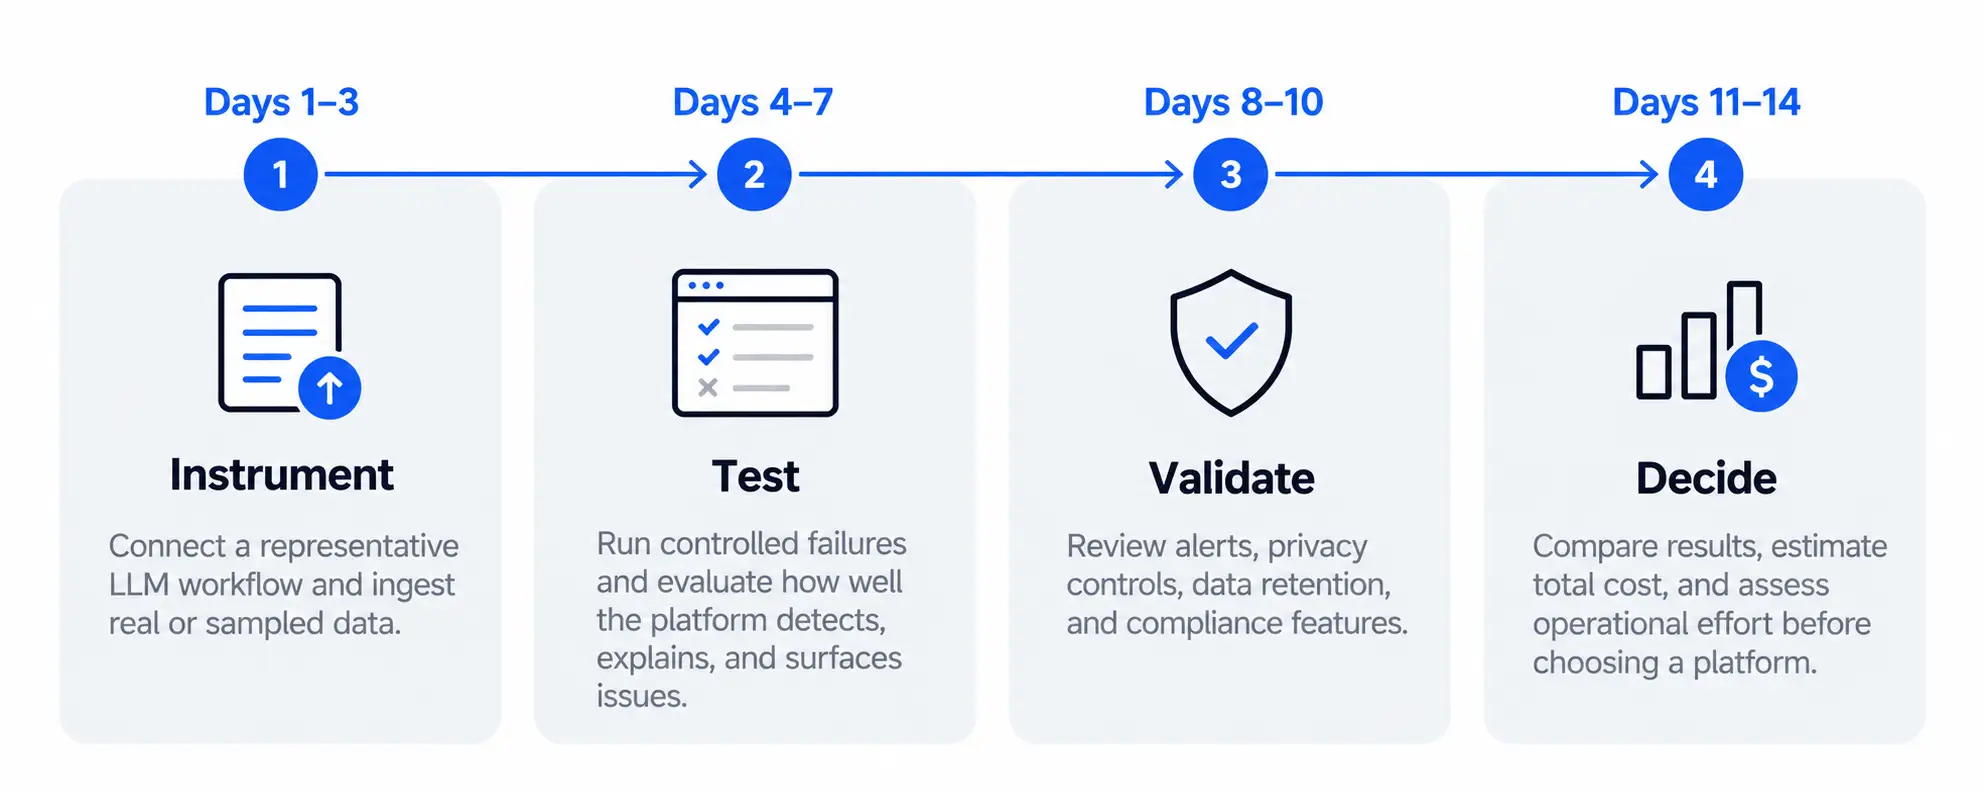
A practical two-week proof of concept
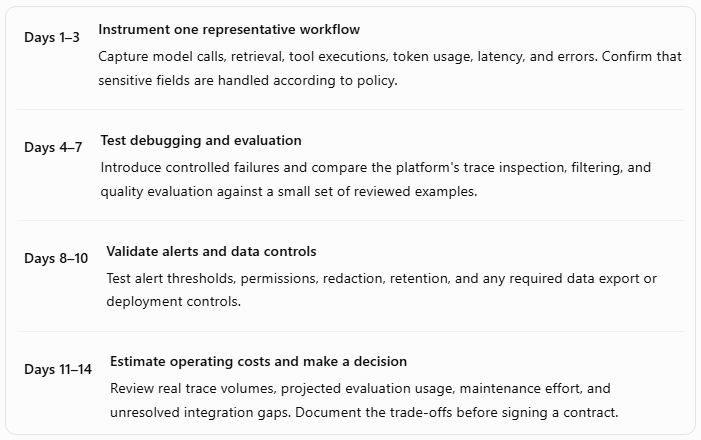
The two-week schedule is a proposed evaluation plan, not a guarantee that every enterprise deployment can be assessed in that time. Complex security reviews, procurement, or legacy integrations may require longer.
What LLM observability platforms cannot solve
Observability makes problems easier to detect and investigate. It does not independently guarantee that a model is accurate, that an agent behaves safely, or that an organization complies with its obligations.
Several limitations deserve attention.
Trace completeness depends on instrumentation. If a framework integration fails to capture a tool call or custom application step, the resulting trace may not show the entire failure path.
Evaluation scores are not proof of correctness. Automated judges can misclassify answers, inherit biases from their evaluation criteria, or miss domain-specific errors. Important applications need representative test cases and human validation.
Monitoring cannot replace application security. An observability dashboard may reveal suspicious behavior, but it is not a substitute for authorization, input validation, access controls, secure tool execution, or dedicated security testing.
Data collection introduces its own risk. Storing full prompts and outputs can expose sensitive information. Teams should decide which fields to capture, who can access them, and how long they remain available.
More telemetry is not always better. Recording every field from every request can increase storage costs, complicate investigations, and collect information that the team does not need. Prioritize telemetry that supports specific debugging, quality, and operational decisions.
These limitations are reasons to design observability carefully, not reasons to avoid it.
Frequently asked questions about LLM observability platforms
What is the best LLM observability platform?
There is no single best platform for every AI application. Langfuse, Arize Phoenix, and MLflow Tracing are worth evaluating for open-source deployments; LangSmith suits many LangChain-oriented workflows; Weave and Braintrust connect tracing with evaluation; and Datadog is relevant to organizations already using its operational monitoring stack. The right choice depends on integrations, evaluation requirements, deployment, privacy, and total cost.
What is the difference between LLM monitoring and LLM observability?
LLM monitoring tracks defined metrics and alerts, such as latency, error rates, token consumption, and quality scores. LLM observability provides the broader context needed to investigate those signals, often through detailed traces, prompts, model outputs, retrieval results, and tool executions. Monitoring can tell a team that quality has declined, while observability can help explain which application step contributed to the decline.
Are there free or open-source LLM observability platforms?
Yes. Langfuse, Arize Phoenix, and MLflow offer open-source options for relevant LLM tracing and evaluation workflows. Open-source software can provide greater deployment control, but organizations should account for hosting, storage, maintenance, security, and support. Free software also does not necessarily mean that every managed service, enterprise feature, or usage level is free.
How much does an LLM observability platform cost?
Pricing depends on the vendor and its billing model. Costs may be based on seats, trace or span ingestion, storage, retention, evaluation usage, or infrastructure consumption. Self-hosted solutions also require operational resources. To estimate the total cost, model monthly requests, spans per request, trace size, retention, evaluation frequency, and required enterprise controls.
What metrics should an LLM observability platform track?
Useful metrics include latency, error rates, token usage, model cost, throughput, and application-specific quality scores. RAG applications may need retrieval relevance and groundedness measurements, while agents may need tool-call accuracy, task completion, and failure rates. Select metrics that correspond to user outcomes and operational objectives rather than collecting every available metric without a clear purpose.
Can LLM observability platforms detect hallucinations?
They can help identify potential hallucinations through evaluation methods that assess grounding, factual consistency, or agreement with a trusted source. However, detection is imperfect. An automated evaluator may miss an unsupported claim or incorrectly flag a valid answer. Teams should validate evaluation methods against reviewed examples and use additional controls when incorrect outputs create significant risk.
Is OpenTelemetry important when choosing an LLM observability platform?
OpenTelemetry can help standardize telemetry collection and make it easier to integrate application instrumentation with different observability backends. It is particularly relevant to teams that want to avoid tightly coupling all instrumentation to one vendor. However, standardization does not ensure that every platform supports identical trace attributes, evaluations, dashboards, or proprietary features. Verify actual ingestion and export compatibility before relying on portability.
How do I evaluate an LLM observability platform before buying it?
Start with a representative AI workflow and instrument it in each shortlisted platform. Test common failures, inspect trace completeness, validate evaluation quality, check alert behavior, and review privacy controls. Estimate costs using realistic usage volumes and retention requirements. A structured pilot provides stronger evidence than relying exclusively on feature lists or vendor demonstrations.
Do AI agents need a different observability platform from chatbots?
Not necessarily, but agent-based systems often require deeper tracing. A simple chatbot may need visibility into prompts, model responses, latency, and token usage. An agent that invokes tools, retrieves documents, retries operations, and coordinates other agents needs traces that capture those steps and their relationships. Choose based on workflow complexity rather than the label attached to the application.
Final verdict: Which LLM observability platform is right for you?
The strongest choice is the platform that makes your specific AI application easier to debug, evaluate, secure, and operate without adding unnecessary complexity.
Choose Langfuse if open-source observability and deployment flexibility are priorities.
Choose LangSmith if its integrations align with your agent development workflow.
Choose Arize Phoenix if you want open-source tracing and experimentation capabilities.
Choose Weights & Biases Weave or Braintrust if evaluation-driven improvement is central to your process.
Choose Datadog if AI monitoring needs to fit into an established enterprise observability environment.
Evaluate LangWatch when experiments and guardrails are important, Helicone for API visibility and gateway workflows, MLflow Tracing for self-managed ML infrastructure, and HoneyHive for complex agent workflows and enterprise data-control needs.
Before committing, run a proof of concept against real application behavior, not just synthetic happy-path examples. Confirm that the platform captures the evidence engineers need, that quality evaluations are meaningful, and that the full operating cost fits the expected workload.
LLM observability is most valuable when it closes the loop between a production failure and a verified improvement. Collecting traces is only the first step. The real outcome is an application that becomes easier to understand and more reliable to operate.
Comments (0)
No comments yet. Be the first to share your thoughts!