Machine Learning for Retail Demand Forecasting in South Korea: What Is Proven, What Is Claimed, and What to Test First

Author
Ravi Prajapati
How machine learning improves retail demand forecasting in South Korea: reported results, model evidence, build vs buy criteria, and compliance checks.
Machine learning improves retail demand forecasting most reliably when it replaces rule-based ordering for volatile, high-volume SKU-store series, and when it forecasts a range of outcomes instead of one number. Korean retailers report gains in ordering effort and stockouts, but those figures are company-reported and unaudited. The strongest independent evidence comes from forecasting competitions and academic studies, mostly outside Korea. This article separates what is demonstrated from what is claimed, and gives a way to choose between building, buying, or combining.
The tension for a commercial buyer is simple. Vendors quote accuracy gains without stating the baseline, the metric, or the product mix. Korea also adds forecasting variables that most global case studies do not contain: regulated hypermarket hours, a fast-growing dawn-delivery market, and a new AI law. A model that scores well on a Walmart dataset can still fail on a Seoul convenience-store lunchbox.
What Does Machine Learning Change in Retail Demand Forecasting?
Machine learning demand forecasting estimates future unit sales for each product and location by learning patterns from history plus outside signals such as price, promotions, weather, calendar events, and stock status. It differs from rule-based reordering, which usually applies a fixed formula to recent average sales, and from classical statistical methods, which model each series mostly on its own history.
Three distinctions matter for a buying decision:
Forecast vs. order. A forecast estimates demand. An order also reflects shelf capacity, delivery cycles, shelf life, and cost of waste versus lost sales. Many products sold as AI forecasting are really auto-ordering systems with a forecast inside.
Global vs. local models. Modern tree-based and neural models train one model across thousands of series, so sparse new SKUs borrow strength from similar ones. Classical methods fit each series separately.
Point vs. probabilistic output. A single predicted number hides risk. Perishable and promotional items need a distribution.
Why Is South Korea a Distinct Forecasting Problem?
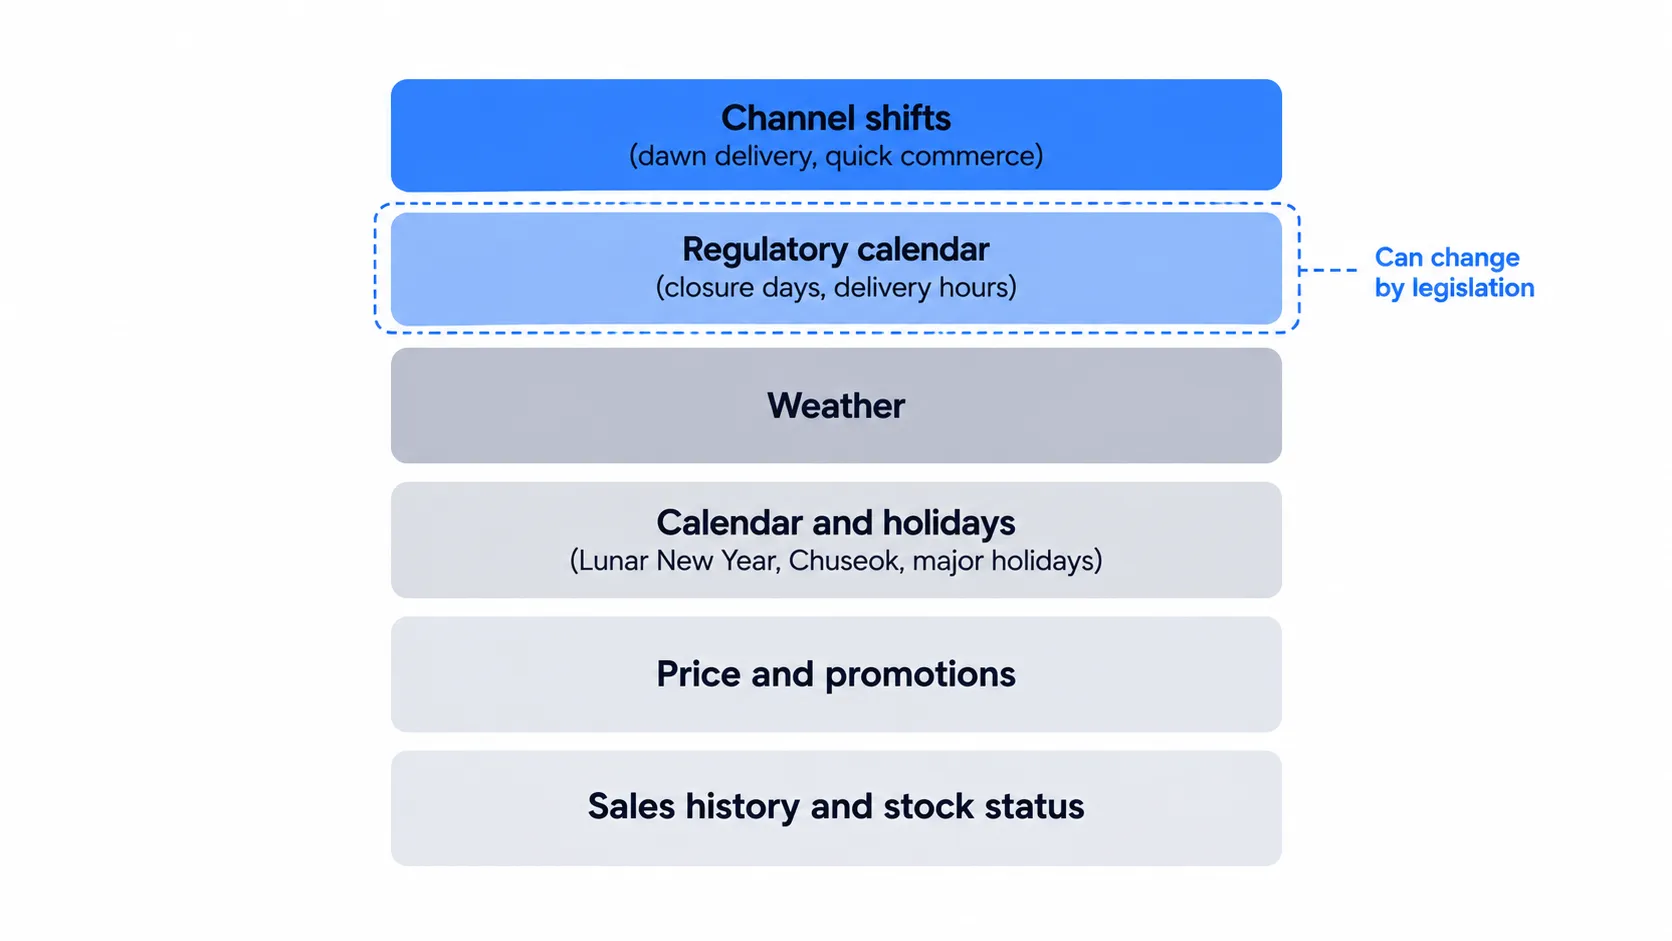
Korea combines high online penetration, fast delivery competition, and store-format regulation. Each changes what a model must know.
Online is a large and growing share of demand. The Ministry of Statistics reported that online shopping transactions reached 25.01 trillion won in May 2026, up 10.3% year on year, and online product sales were 29.8% of total retail sales. Definitions matter here. A Korea JoongAng Daily editorial puts online at 59% of domestic distribution, a figure with a different denominator. Any model that joins online and offline data must reconcile these definitions first.
Hypermarket demand follows a regulatory calendar. Under the Distribution Industry Development Act, large hypermarkets must close two days a month and may not operate between midnight and 10 a.m., which also blocks online delivery from those stores. Local authorities choose the closure day, and a KDI report cited by The Korea Times found that moving the closure day from Sunday to a weekday improved sales. So closure days differ by municipality and can change. An earlier Korea Chamber of Commerce and Industry survey reported that 49.5% of respondents shop through other channels when hypermarkets are closed, which means closed days shift demand rather than erase it.
The rules may change, which is a forecasting risk in itself. As of a September 18, 2026 report, five bills to ease hypermarket restrictions were pending in the National Assembly, and the lead bill had been in a subcommittee since May 19 without review. Meanwhile, Naver was reported to be entering dawn delivery in October, in a market that grew from 2.5 trillion won in 2020 to nearly 15 trillion won. Treat the legal status of dawn delivery as a scenario variable, not a constant.
What Have Korean Retailers Actually Reported?
Public evidence is mostly press coverage of company statements. None of the figures below comes with a disclosed baseline or method, so they should be read as reported claims, not verified results.
Retailer | System as reported | Reported result | Claim status |
|---|---|---|---|
CU (BGF Retail) | Smart Order 2.0, deep-learning auto-ordering, expanded from a few categories to about 4,000 products (Beautynury) | After rollout began, stockouts fell 20.8% and sales rose 4.8%; ordering time fell by 30 to 60 minutes | Company-reported, no baseline or method disclosed |
E-Mart24 (Shinsegae I&C) | Sparos AI demand forecasting, trialed in 13 stores | At one flagship store, ordering time dropped from over an hour to 5 minutes | Company-reported trial, effort metric only, no accuracy figure |
GS25 (GS Retail) | Machine-learning auto-ordering for lunchboxes, gimbap, rice balls, sandwiches and burgers; a separate order and display recommendation system using loyalty-app data was announced in 2024 | No performance figures found | Reported use, outcomes unverified. Rollout scope of the 2024 plan was not independently confirmed |
Kurly | AWS case study lists ML services for demand forecasting among reasons for choosing AWS | No outcome figures in the retrieved text | First-party case study from 2020 |
Two patterns stand out. First, the headline metrics are labor saved and stockouts avoided, not forecast error, which makes comparison across companies impossible. Second, convenience chains lead in public reporting, probably because franchise owners feel ordering effort directly. That is an inference, not something the sources state.
Which Models Perform Best in Retail Forecasting Evidence?
Gradient-boosted trees such as LightGBM remain the safest starting point for store-level retail, and deep learning has not displaced them in most independent comparisons.
The M5 forecasting competition asked entrants to predict 42,840 hierarchical Walmart sales series. A later paper describes the winning LightGBM-style submission as beating the best benchmark, univariate exponential smoothing, by 22.4%. A study of the M5 data's representativeness found only minor differences from other retailers' data, which supports, though does not prove, transfer to other markets.
A 2025 comparison of modern models for brick-and-mortar sales reports that LightGBM-based ensembles outperformed deep learning models, including ones from Amazon's forecasting team, and notes that Zalando's research suggests transformer models improve predictably with more training data. The practical reading: neural models may win at very large, data-rich online retailers, while tree models are hard to beat for physical stores with intermittent demand.
The same paper observes that much deep learning success comes from centralized online retail. Korean convenience chains, with thousands of small stores and sparse SKU-store series, resemble the harder case.
Korean academic work illustrates a related point. One Sogang University study improved XGBoost forecasts by grouping products by demand pattern and tuning window size per group, but it used a public UK online retail dataset, not Korean store data. Published Korean research often cannot answer Korean operational questions because retailers rarely release data.
What this evidence does not cover. The sources above do not test newer pretrained time-series foundation models on Korean data, and this article makes no claim about them.
Why Do Point Forecasts Fail on Perishable Items?
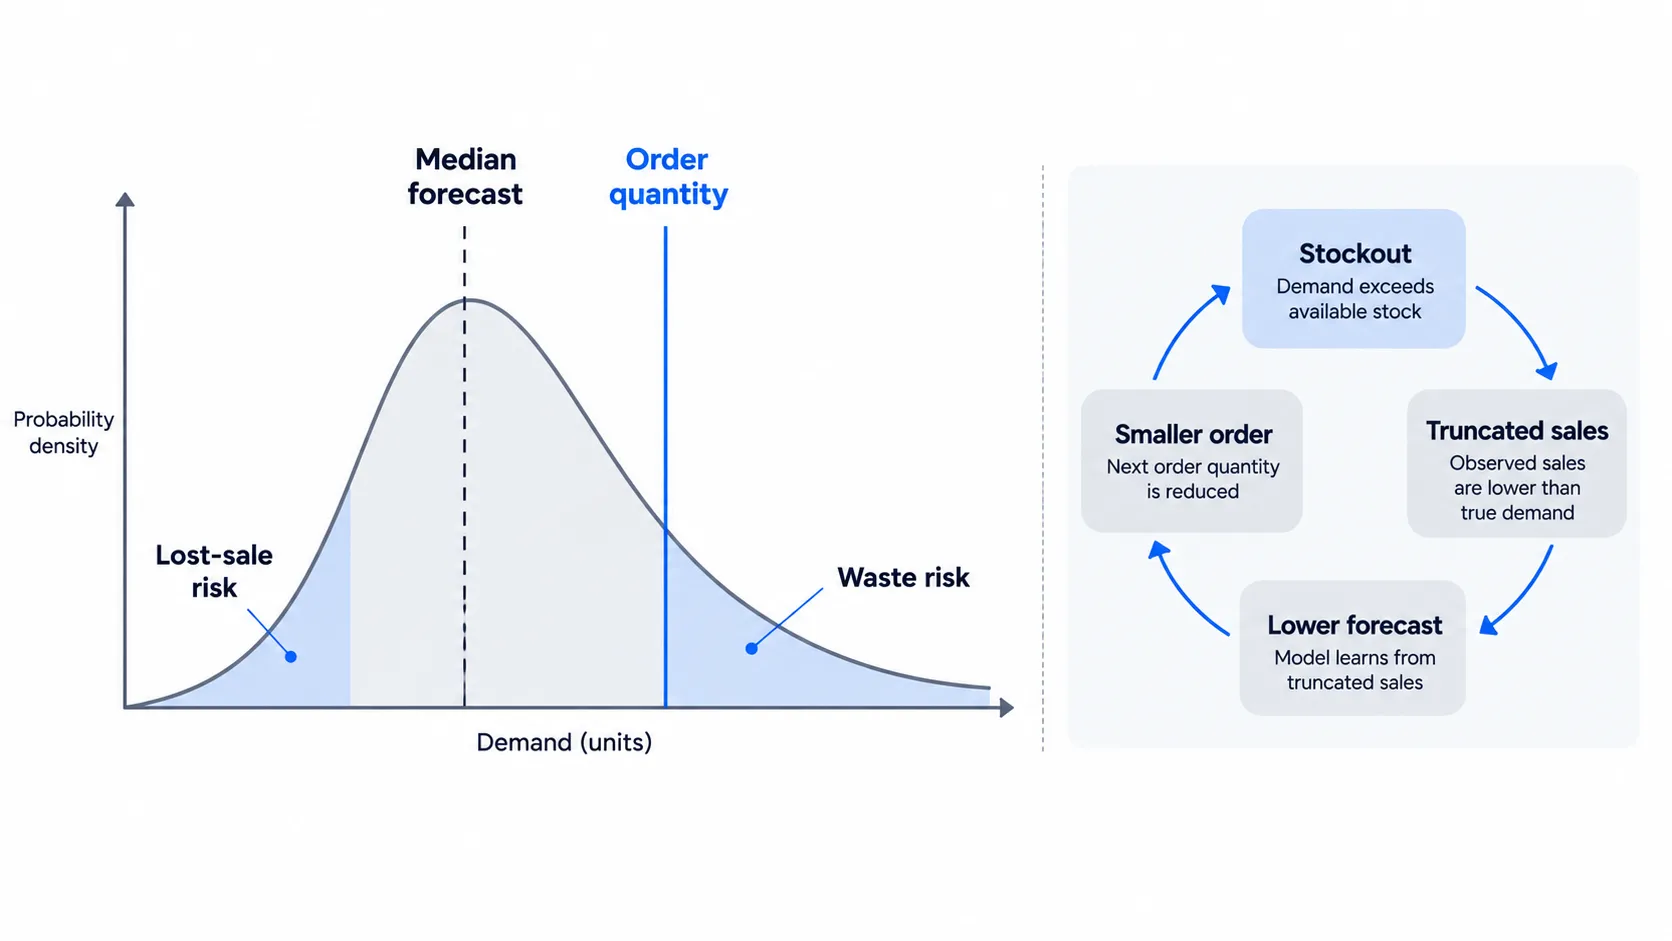
A point forecast fails on perishables because it ignores the unequal cost of ordering too much versus too little, and because sales data understates demand whenever a product sells out.
Censored demand
When a shelf empties at 6 p.m., recorded sales stop, but demand did not. A model trained on those sales learns that demand is lower than it was and recommends smaller orders, which causes more stockouts. The FreshRetailNet-50K dataset, released by researchers working with a Chinese fresh-grocery retailer, was built to study this: 50,000 store-product series from 898 stores and 863 perishable SKUs with hourly stockout labels. The authors argue that models treating censored sales as true demand create systematic underestimation. The data is not Korean, but the mechanism applies to any chain with lunchbox or fresh-food stockouts. Check whether your history records stockout hours. If it does not, your training data is biased before modeling starts.
Quantile orders
The order quantity that maximizes profit is a quantile of the demand distribution, set by the ratio of lost-sale cost to waste cost. The M5 Uncertainty competition evaluated exactly this, asking for nine quantiles per series.
Hypothetical example, with assumed numbers. A store sells a lunchbox for 4,500 won, pays 2,000 won, and the unsold box is worth nothing. A lost sale costs 2,500 won of margin and a wasted box costs 2,000 won, so the target is the 2,500 / 4,500, or about 56th percentile of demand. The best order sits above the median forecast. Change the cost to 2,500 won and the target drops to the 44th percentile. The same demand model, two different orders. This is an illustration, not a real case, and it ignores customer goodwill and markdowns.
Should You Build, Buy, or Combine?
Buy when forecasting is not a differentiator and your data is clean enough for a packaged tool to use. Build when forecast quality drives your margin and you control rich data. Use a hybrid when a vendor supplies the pipeline and you own the features and evaluation. The matrix below is editorial analysis based on the evidence above, not a tested scoring model.
Situation | Likely best fit | Why | Main risk |
|---|---|---|---|
Franchise convenience chain, thousands of small stores, fresh items | Vendor or in-house system integrated with ordering terminals | The value is in order recommendation at the store, which needs workflow integration | Owners override or ignore recommendations; stockouts not logged |
Hypermarket chain with regulated hours | Hybrid: own regulatory-calendar features, vendor engine | Closure-day logic is local and changing | Law changes mid-contract |
Quick-commerce or dawn-delivery grocer | Build or deep customization | Hourly stock status and delivery-slot data are the edge | Censored demand bias if stock status is not captured |
Mid-size retailer without a data team | Buy, with strict pilot terms | Staffing a forecasting team is the larger cost | Vendor accuracy claims that cannot be reproduced |
Retailer with promotion-heavy calendar | Hybrid with explicit promotion features | Promotions are planned by the retailer, so planned effects should enter as inputs | Cannibalization across SKUs missed |
How Do You Test a Vendor's Accuracy Claim?
Ask for the baseline, the metric, the level of aggregation, and a holdout test on your own data. Vendor pages routinely quote numbers such as 80 to 85% accuracy at the item, store and day level, which are vendor claims. The accuracy definition is the part that matters, because a metric can look high on fast-moving items and still fail on the long tail.
A practical checklist:
Baseline. Which method is the improvement measured against: last week's sales, a moving average, the retailer's current system?
Metric. Is it MAPE, WAPE, RMSSE, or pinball loss? MAPE breaks on low volumes and zeros, which are common in stores.
Level. Is accuracy reported at SKU-store-day or aggregated to category-week? Aggregation makes any model look better.
Holdout. Run a blind test on your last 8 to 12 weeks, including at least one holiday and one promotion.
Stockouts. How does the system treat censored sales?
Business outcome. Do you measure waste, availability, and margin, not only forecast error?
Overrides. Can store staff override orders, and are overrides logged for learning?
Explainability. Can planners see why a forecast changed?
The Zalando-style scaling result and the M5 results both rest on large public or internal datasets. Neither guarantees the same outcome on your data, which is why the holdout matters more than any quoted benchmark.
What Do Korean Regulations Mean for a Forecasting System?
Most replenishment forecasting is probably outside the AI Basic Act's high-impact category, but that is an inference that needs legal confirmation for your use case.
Korea's AI Basic Act and its Enforcement Decree took effect on January 22, 2026. According to Cooley's overview, high-impact AI covers critical sectors such as healthcare, energy, transportation, hiring and biometric analysis, and the Ministry of Science and ICT indicated a grace period of one year before administrative fines. A presencis timeline notes an amendment took effect on July 21, 2026, so check the current consolidated text on law.go.kr.
Three practical implications follow. Inventory ordering is not an obvious high-impact domain. A forecast reused for staff scheduling or hiring decisions could move closer to one. And loyalty-app data used as model input falls under Korea's personal information rules, so involve counsel before using customer-level data. A fourth point from the section on Korean distribution rules above: the Distribution Industry Development Act is a demand driver you must model, not a compliance item.
What Machine Learning Cannot Solve
Models cannot repair missing stockout logs, cannot predict a law passing, and cannot replace a decision about how much waste you are willing to accept.
Data gaps. If you never recorded stockouts, you cannot recover the demand you missed. Fixing capture often beats changing the algorithm.
Structural breaks. A new dawn-delivery entrant or a rule change can invalidate history. Scenario planning helps more than a better model.
New products. Viral items with short lifecycles have little history. Similar-item transfer helps but is not reliable.
Adoption. A forecast that store owners override does nothing. Reported time savings suggest owners value convenience, but override rates were not disclosed in any source reviewed.
Counter-view. Simple methods can be close. Research on fast and frugal retail forecasting found that reduced pools of simple methods can run faster without large accuracy losses. Complexity should be earned by a measured gain.
FAQs
Does machine learning really improve retail demand forecasting?
Yes, in competition and academic evidence, though gains depend on data and baseline. The M5 winner beat the best statistical benchmark by 22.4% on Walmart data. Korean chains report fewer stockouts and shorter ordering time, but those results are company-reported and unaudited.
Which algorithm should a Korean retailer start with?
Start with gradient-boosted trees such as LightGBM. Independent comparisons of store-level retail data found them equal to or better than deep learning in most settings. Add neural models only if a holdout test on your own data shows a measurable gain.
What data does a forecasting model need?
At minimum: daily or hourly sales by SKU and store, stock status including stockout hours, prices, promotions, and a calendar. Weather, local events, and municipal closure days improve results for physical stores. Customer-level data adds value but triggers privacy obligations.
How long does a pilot take?
Plan roughly 8 to 12 weeks for a credible holdout covering at least one holiday and one promotion. This is an editorial recommendation, not a measured industry average. A shorter test may miss the events where models fail.
Is demand forecasting regulated under Korea's AI Basic Act?
Probably not as high-impact AI for ordinary inventory use, since listed high-impact areas include healthcare, energy, transport, hiring and biometrics. That is an interpretation. Confirm with counsel, especially if forecasts feed workforce decisions or use personal data.
Should I trust vendor accuracy claims?
Treat them as claims until reproduced. Ask for the baseline, metric, aggregation level, and a blind test on your data. Accuracy at category-week level says little about SKU-store-day performance.
Conclusion: Is ML Demand Forecasting Worth It for Korean Retailers?
The evidence supports using machine learning for demand forecasting, with conditions. Independent studies show tree-based models reliably beat simple baselines in retail, and the stockout and quantile problems are well documented. Korean public evidence is thinner: reported deployments show reduced ordering effort and fewer stockouts, but without baselines or audits. What is uncertain is how much of those gains transfer to your assortment, and how Korean hypermarket and delivery rules will change over the next year.
The practical takeaway is to start by fixing stockout logging, run a blind holdout of 8 to 12 weeks against your current ordering method, measure waste and availability alongside forecast error, and model the regulatory calendar explicitly. Buy a tool only after it beats your baseline on your data.
Comments (0)
No comments yet. Be the first to share your thoughts!